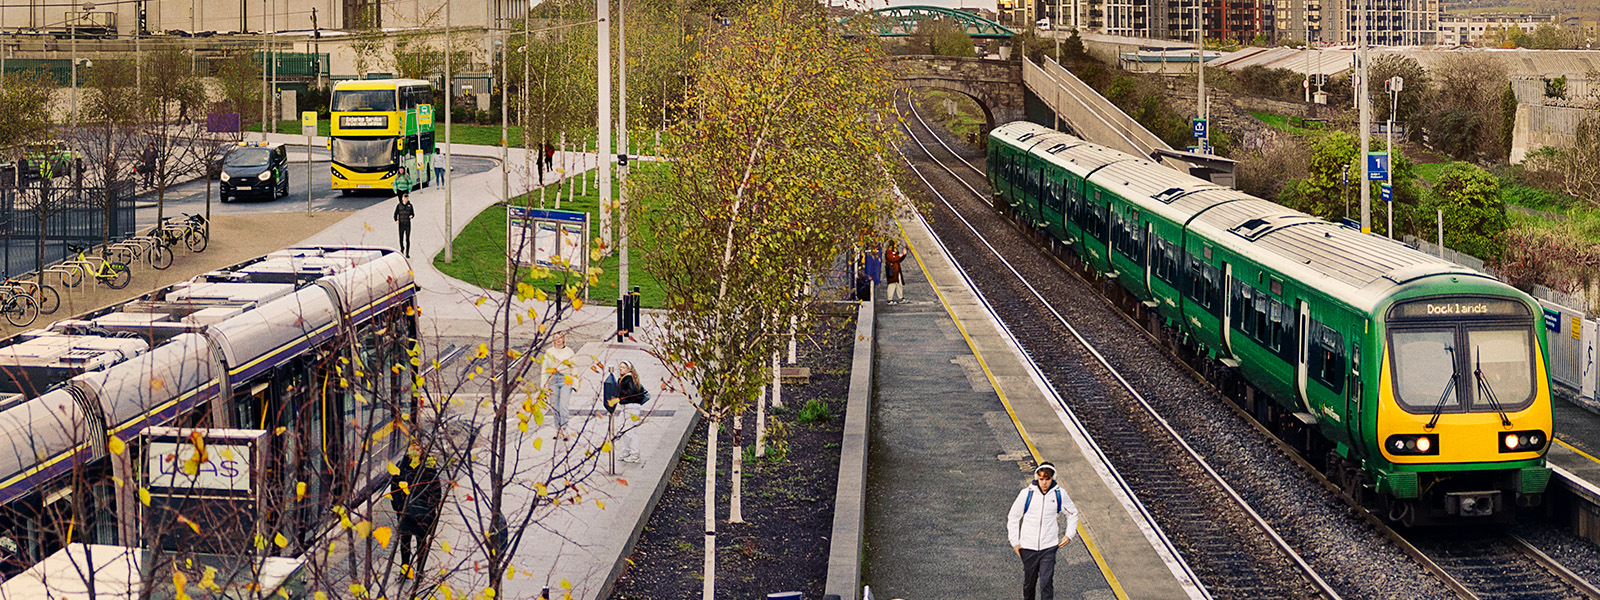
The numbers of people using sustainable modes of transport to travel into Dublin city centre increased further in 2016, and now accounts for over two thirds of all journeys.
According to the Canal Cordon Report 2016 published by NTA and Dublin City Council, 134,559 people travel into the city centre at peak time using bus, train, Luas, walking or cycling. This is up from 132,188 in 2015.
By contrast, the numbers of people entering the city centre by car, is down from 67,755 in 2015 to 67,442 in 2016.
This means that the gap between people using sustainable modes and non-sustainable modes of transport continues to grow. Sustainable journeys accounted for 67% of journeys in 2016, compared to 66% in 2015.
The number of sustainable journeys in 2010 was 59% and it has increased every year since.
| Mode | 2006 | 2007 | 2008 | 2009 | 2010 | 2011 | 2012 | 2013 | 2014 | 2015 | 2016 |
| Sustain Modes | 125,843 | 128,488 | 128,437 | 114,350 | 106,415 | 111,227 | 114,304 | 121,648 | 126,042 | 132,188 | 134,559 |
| Car,
Goods, Other |
81,536 | 75,471 | 71,330 | 74,190 | 74,627 | 72,342 | 71,150 | 70,540 | 66,628 | 67,755 | 67,442 |
| Total | 207,379 | 203,959 | 199,767 | 188,540 | 181,042 | 183,569 | 185,454 | 192,188 | 192,670 | 199,943 | 202,001 |
| Mode | 2006 | 2007 | 2008 | 2009 | 2010 | 2011 | 2012 | 2013 | 2014 | 2015 | 2016 |
| Sustainable Modes | 61% | 63% | 64% | 61% | 59% | 61% | 62% | 63% | 65% | 66% | 67% |
| Car,Goods & Other | 39% | 37% | 36% | 39% | 41% | 39% | 38% | 37% | 35% | 34% | 33% |
Table 2.5– Mode share of people crossing the Canal Cordon by sustainable modes 2006-2016
National Transport Authority Chief Executive Anne Graham said: “What we are witnessing here, not just in 2016, but over a period of the last six years or so, is a steady shift from the car to the more sustainable alternatives like public transport, cycling and walking.
“But these things don’t happen by accident, and it is thanks to the customer-focused approach of the transport operators and other public agencies including DCC and NTA, that this shift is under way.
“We have seen innovations such as Leap Card, Real Time Passenger Information, journey planner apps etc, and these when combined with investment in transport infrastructure such as Luas Cross City, more buses for Dublin Bus and Bus Éireann, and rail projects like Phoenix Park Tunnel, make public transport an increasingly attractive alternative to the car.
“To build on this momentum, we need an ambitious investment programme around bus prioritisation measures in the Dublin area, just as we need to copper-fasten investment in plans such as those for Metro North and Dart Expansion. We also need to continue to build on the success of our cycling programmes by building more cycleways and by working with DCC and the other local authorities in the area to expand the Coke Zero Bike share scheme.”
The report has been circulated to members of Dublin City Council Transport SPC for discussion at their next meeting.
Data on the movement of people across the Canal Cordon has been assembled from a number of sources for this report, including:
- Dublin City Council Canal Cordon survey
- Dublin Bus Canal Cordon Survey
- Iarnród Éireann Census
- Transport Infrastructure Ireland (TII) annual census at all LUAS tram stops.
By combining these four data sources, the NTA and DCC have been able to compile a comprehensive picture of the modes of travel used by people travelling across the Canal Cordon into the City in a typical AM peak period.
Further details of methodology are contained in report.
Full report available through this link – Canal Cordon Report 2016.pdf
